A road network does not collapse in one year. That is why a cut in maintenance always looks cheap: the roads look much the same next spring, and the bill arrives years later, paid mostly by the people who drive on them.
A strategy analysis puts that bill on the table before the decision is made. In 2024 SirWay and AFRY carried one out for the Finnish Transport Infrastructure Agency (FTIA): a 30-year life-cycle model of the whole paved state road network, 2025–2054, with HDM-4. The question was simple to ask and hard to answer: what pavement budget keeps the total cost to the road agency and road users lowest, and what happens at the budgets Finland is actually planning?
Why it matters now
Finland is deciding its 2027 road budget. The extra repair-backlog funding of 2024–2026 ends this year, and the government proposes about €1.29 billion for the basic maintenance of state roads, railways and waterways in 2027. The Ministry of Transport and Communications asked for €130 million more for roads; the government’s budget talks left it unfunded. Parliament votes in December.
On 22 October FTIA published an overview of the state road network (in Finnish). About 10,700 km of paved road, a fifth of the paved network, is already in poor condition. Structural repairs reach about 320 km a year, against almost 1,000 km in the early 2000s. The overview sets three funding levels. The lowest, “scarcity continues”, follows the General Government Fiscal Plan (JTS), the government’s four-year spending frame. Level 1, about €1.8 billion a year, follows the National Transport System Plan (Liikenne 12). It is also the level that the Service Sector Employers Palta and the Finland Chamber of Commerce ask for from 2027.
Our model covers the pavement part of both levels.
How the model works
- The network. 53,162 carriageway-kilometres of paved state road from the national road database (Velho), cut into 100-metre segments and grouped into eight subnetworks by traffic and pavement type, from low-volume soft asphalt roads to motorways. Cycle paths and ramps were left out.
- Condition and structure. Roughness (IRI) and rutting from the annual condition surveys, layer thicknesses from network-level ground-penetrating radar, and bearing capacity from FTIA’s measurements.
- Deterioration. HDM-4 pavement models calibrated to follow FTIA’s own deterioration models.
- Works. FTIA’s typical maintenance chains for each subnetwork, from patching to resurfacing and structural repair, with unit costs.
- Road users. Vehicle operating, travel time and CO₂ costs, with the fleet shifting from combustion engines to electric, gas and hydrogen vehicles according to national forecasts.
- Budgets. An unconstrained optimum, and the budget scenarios of the fiscal plan and of Liikenne 12. HDM-4 then chooses which works to do, where and when, to get the most out of each budget.
What it shows
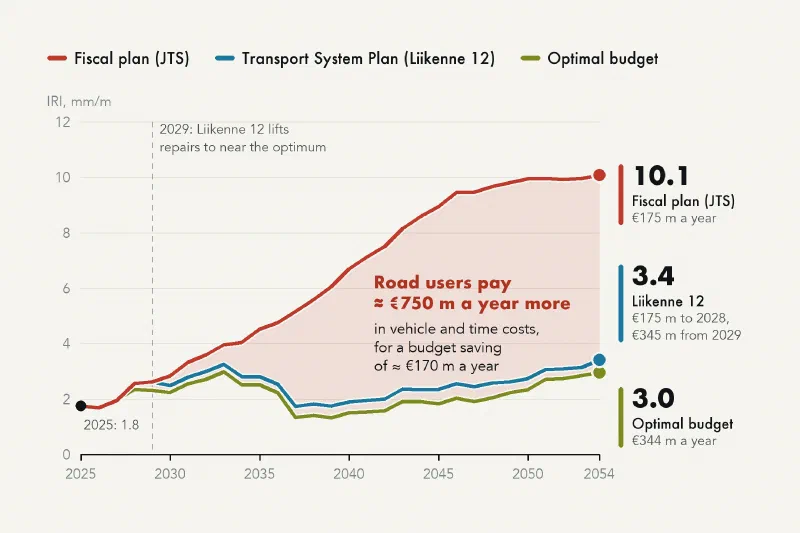
- The optimal budget is about €344 million a year for pavements: €309 million for repairs and €35 million for routine works. At that level the costs of the road agency and road users together are lowest. The fiscal-plan level gives about €175 million.
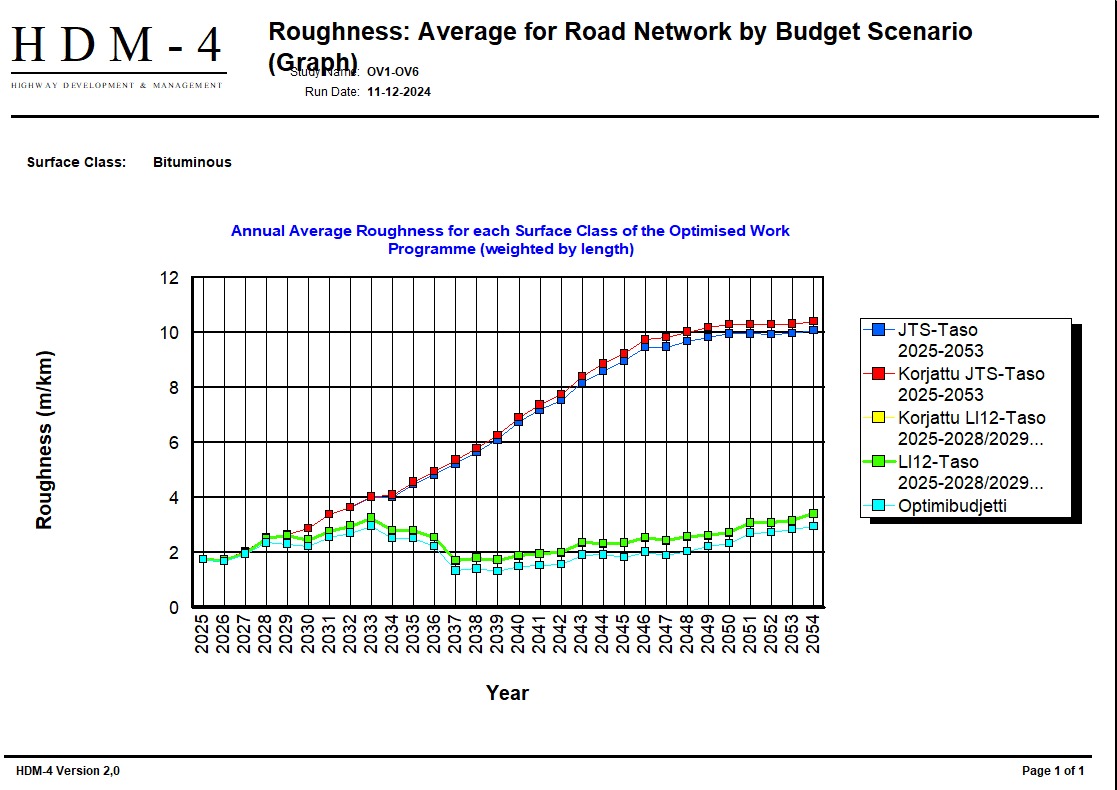
- At the fiscal-plan level, average roughness rises from about 2 to over 10 mm/m in 30 years. Road users lose about €750 million a year in vehicle and time costs, against a budget saving of about €170 million. The saving is real, but it is paid back four times over.
- The Liikenne 12 funding would bring pavements close to the optimum from 2029. Its repair budget from 2029 is about the same as the optimal one; roughness stays between 2 and 3.5 mm/m.
- With less money, the busiest roads come first and low-volume roads decline. For about 8,300 km of low-volume paved road, the next resurfacing no longer pays back in road user benefits alone. Before any of it is turned back to gravel, gravel maintenance costs belong in the sum; this analysis did not model them. The figures cover pavement repair and routine works on the paved state road network, without VAT. They are not the whole basic maintenance budget, which also pays for bridges, winter maintenance, gravel roads, railways and waterways.
A strategy analysis is not a one-off study
This analysis took months, because the data had to be pulled out of the road database, cleaned, grouped and fed into a separate model. By the time such a study is finished, new condition data has been collected and the budget debate has moved on.
It should be the other way round. A strategy analysis belongs inside the asset management system, fed directly from the road register and the condition surveys, and rerun every year as new data arrives. Then the same system that answers “how much do we need?” also answers “which roads first?” and “does this project pay back?”. SirWay RAMS is built that way: strategy analysis sits next to multi-criteria maintenance planning and NPV/IRR financial analysis, on the same network data.
FTIA’s overview proposes tying basic maintenance funding to a cost index, so that a budget agreed today still buys the same amount of work in five years. Our model shows why that matters: the difference between a road network that holds its value and one that declines is not a dramatic cut, but a budget that quietly falls behind.
The December vote sets 2027. The government formed after the April 2027 parliamentary elections sets the years after.
Who did the work
The strategy analysis was carried out in 2024 by SirWay and AFRY for the Finnish Transport Infrastructure Agency. The figures in this article come from the final report, Tieverkon elinkaarianalyysi 2025–2054 – HDM-4-mallinnus (December 2024). The funding levels and network condition figures are from FTIA’s overview of the state road network (Väyläviraston julkaisuja 73/2026). The chart above the article is redrawn from the HDM-4 output.
Would you like the same analysis for your network? Write to Dr Konsta Sirvio at konsta.sirvio@sirway.fi.