A cycle path does not wear like a road. No heavy lorries drive on it, so it does not rut or lose its bearing capacity the way a road does. It ages, cracks and breaks at the edges, and for a cyclist a single pothole or a wide crack is a real danger, much more than a hundred metres of hairline cracks.
The Finnish Transport Infrastructure Agency (FTIA) manages about 6,000 kilometres of walking and cycling paths along the state roads. Until recently their condition was assessed visually in the field, where the inspector decided on the spot which stretches needed resurfacing. The register kept only that decision, not the reason for it. Minimum-length rules dropped short dangerous spots from the programme, and news of a dangerous hole usually arrived as a complaint from a cyclist.
From 2021 to 2023 SirWay and AFRY worked with FTIA and two regional ELY Centres (Pirkanmaa and North Ostrobothnia) to find a better way. The method below is the result. It is written for any road owner, state or municipal, that manages walking and cycling paths.
1. Start from the cyclist
We asked users first. A survey of walking and cycling path users drew 401 answers and almost 200 free-text comments. Condition was the most important group of factors (3.8 on a scale of 1–5), followed by safety and functionality (3.6 each) and comfort (2.8). Within condition, users named large potholes and wide cracks as the damage they fear most. The experts had said the same.
That answer sets the rest of the method. The condition variables, their weights and the maintenance rules are chosen from the cyclist’s point of view.
2. Let cyclists collect the data
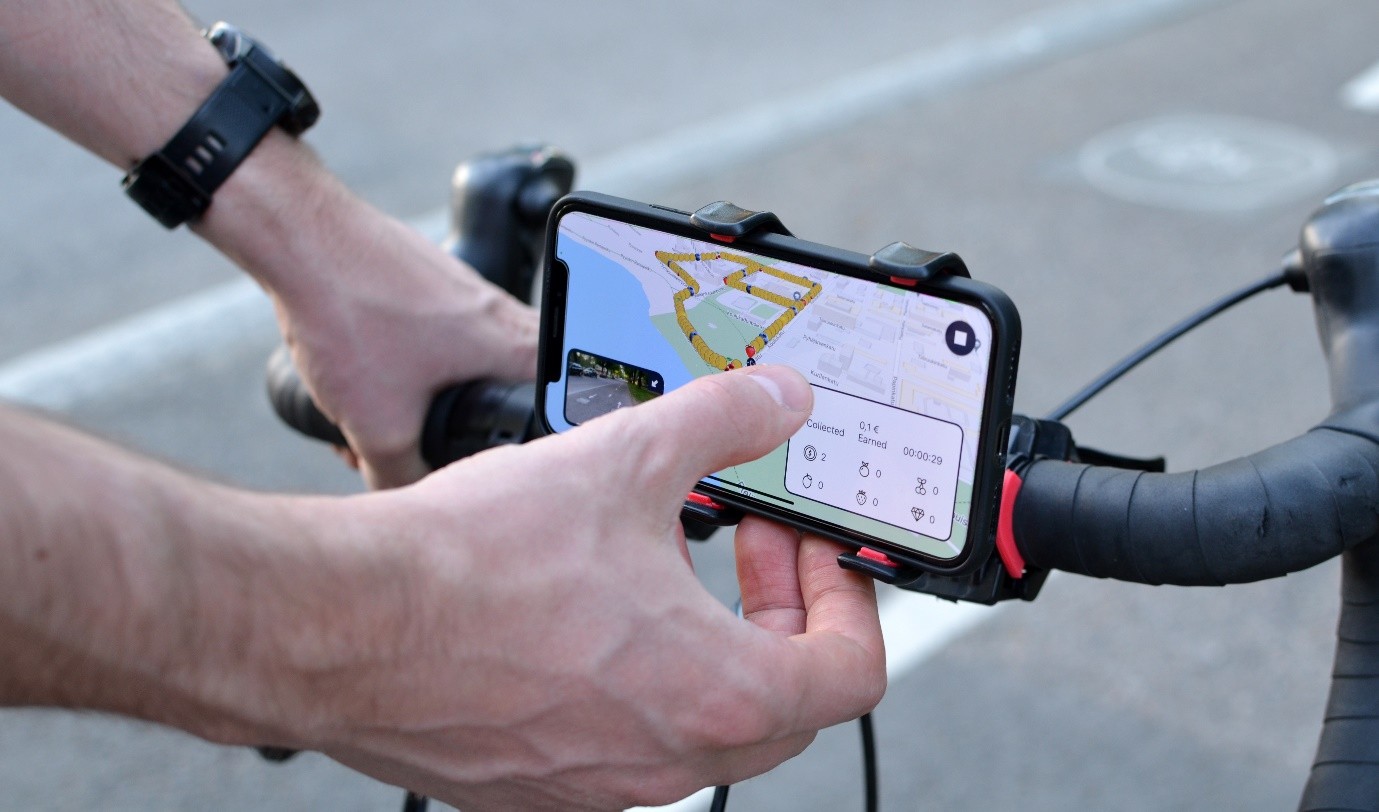
The video was collected by ordinary cyclists with a mobile game from Crowdchupa (now Crowdsorsa). Virtual objects worth money are placed along the paths to be surveyed. A cyclist collects them by recording GPS-tagged video with a phone on the handlebar and is paid at the end of the day for the videos that pass the quality check. An object disappears once someone has collected it, so no stretch is surveyed twice, and a rejected video returns its objects to the map for someone else. Higher rewards on short, scattered stretches make up for the extra riding.
It works. In the regions surveyed, most of the network was covered within the first days of each campaign and all of it within a few weeks. Local and national media covered the events, and the participants found the game fun.
Crowd-sourced data needs firm quality control. The lessons from three campaigns:
- Camera angle. A horizon line in the app keeps every camera at the same angle. Before it was added, many cameras pointed too low.
- Surface and light. Wet surfaces, shaking and blurred video make the detection unreliable. They should be rejected, not processed.
- Coverage. The data collector should report which stretches are missing and why, so that the gap does not surface only at the analysis stage.
- Positioning. Phone GPS is not exact, and overlapping videos of the same stretch have to be filtered out.
3. Let computer vision measure the damage
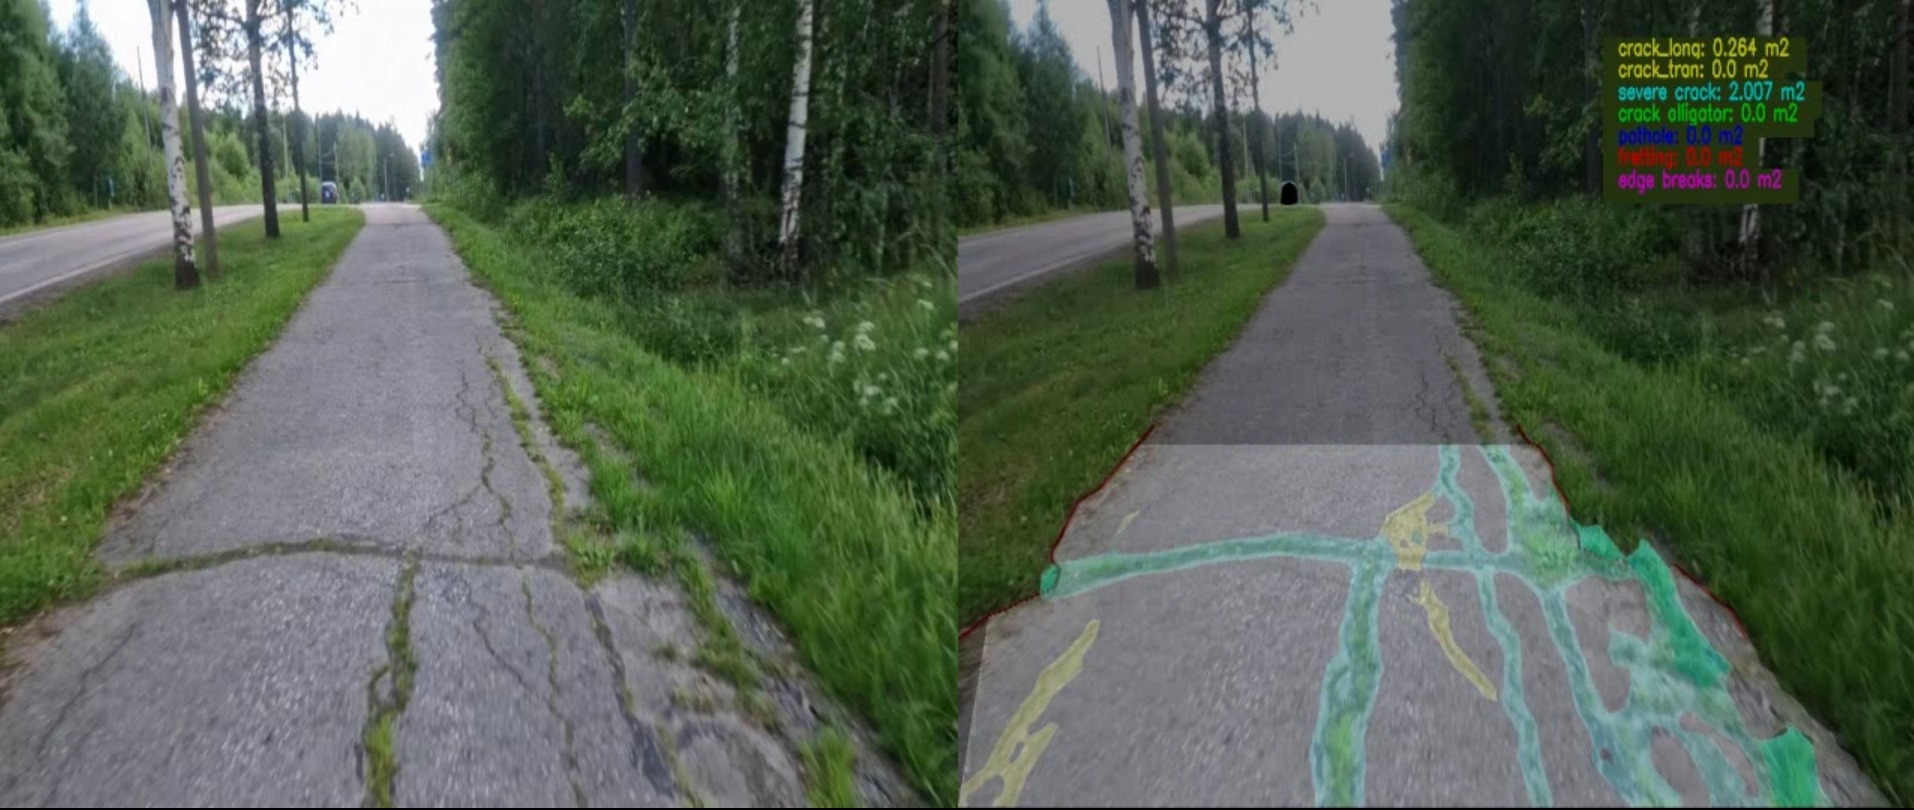
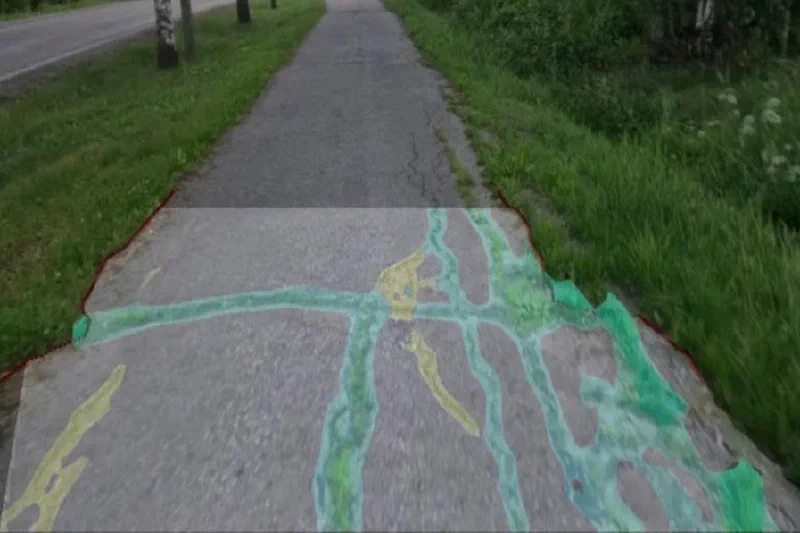
Computer vision then finds the damage in the video. In 2021 and 2022 a model detecting 15 damage types was used (Vaisala’s). In 2023 the project used Flowity’s model, which measures six types: potholes, longitudinal, transverse and wide cracks, alligator cracking and edge damage. It analyses the path 2.5 metres at a time and reports the result per 10-metre segment.
Three conclusions came out of comparing the two:
- Fewer damage types work better. Too many classes confuse the model, and a short, clear list lets several suppliers bid for the survey. Ravelling was left out because no model detected it reliably on cycle paths.
- Measure in square metres. A model that reports the actual area of each damage type is more realistic than one that reports a share of the path width, which overestimates damage. Square metres are also what a maintenance budget is calculated from.
- Measure every year. Crowd-sourcing and computer vision make an annual survey cheap and safe. A one-year cycle finds dangerous damage in time and gives the trend that the forecasts need. Survey contracts of three to five years make it worthwhile for suppliers to invest.
4. Weight the condition index for safety
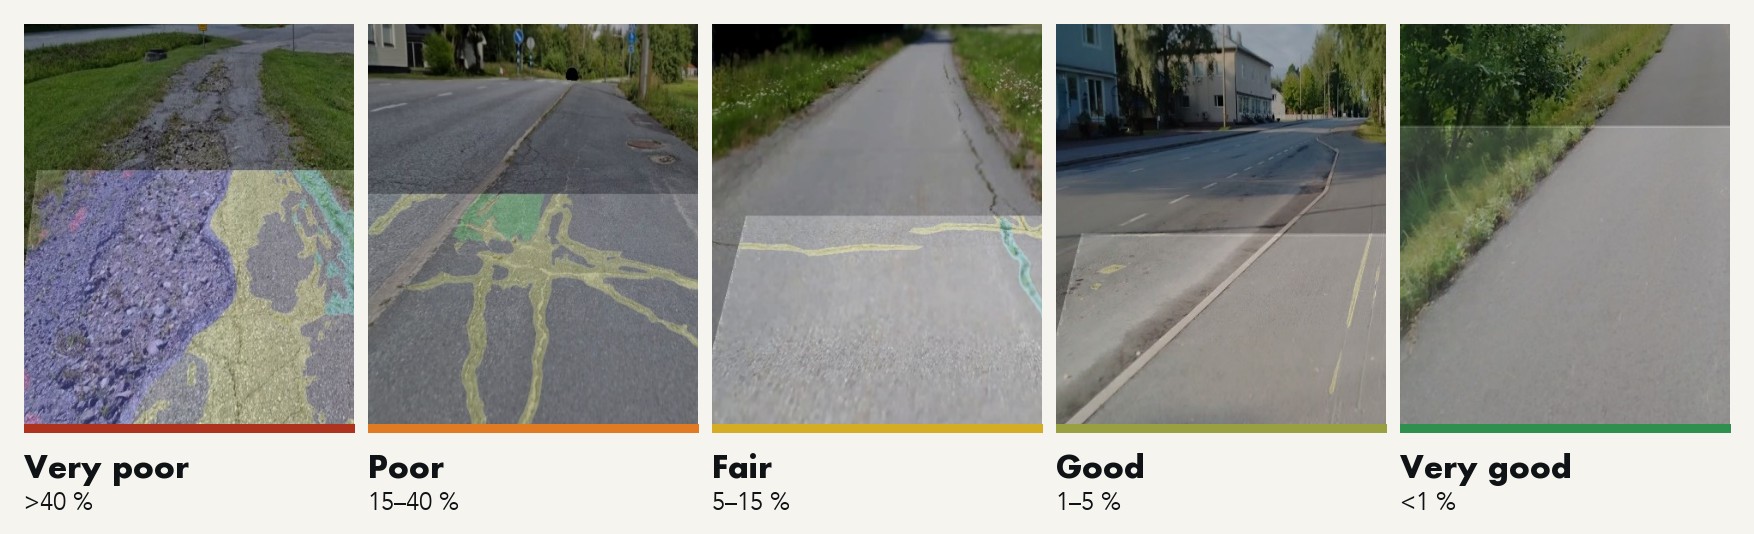
Every damage type enters the damage sum by its area. A pothole or a wide crack covers a much smaller area than alligator cracking but is far more dangerous, so in the condition index a wide crack counts 3.5 times its area and a pothole five times. Paths with these defects then reach the programme even when the damage is small.
The weighted damage sum, as a share of the pavement area of the segment, gives five condition classes:
5. Turn 10-metre segments into resurfacing sites
Nobody resurfaces ten metres at a time. Each class has its own treatment:
| Condition class | Treatment |
|---|---|
| Very poor, poor | Resurfacing, resurfacing with reinforcement mesh, or rehabilitation |
| Fair | Pothole and crack patching with mastic asphalt or cold mix |
| Good, very good | Patching and crack sealing as needed |
Merging rules then join the poor segments into workable sites. In the project a site starts from 20 metres of poor or very poor path, and a stretch of up to 40–50 metres between two sites is included, so that one better segment does not break a site in two. The rules were agreed with the ELY Centres’ maintenance experts.
Grouping the sites into contracts is still done by people, because it depends on location and on priorities: user numbers, schools and services along the path, and the winter maintenance class. Dangerous damage that does not fit into this year’s resurfacing programme goes straight to routine repair. Since the computer vision reports each damage type separately, the next step is to choose the treatment from the damage type itself, which brings network planning close to project-level design.
6. Forecast the funding need
Two years of measurements on the same paths give a deterioration model. Because phone GPS moves damage from one 10-metre segment to the next, the data is averaged over 50-metre segments, and segments that improved without recorded maintenance are left out.
The simplest model is also the most useful: without maintenance, the weighted damage sum of a segment grows by about a quarter a year, and the growth accelerates. With the model the road owner can estimate the funding need for the next ten years and show what each budget level does to the network. A tighter resurfacing budget is not free either: the patching needed in the meantime grows quickly.
A model does not replace measurement. It fills gaps between surveys and supports strategic planning, and it gets better each year as new data arrives.
7. Look beyond the pavement
Cyclists judge a path by more than its surface. The project also built a service level index from twelve variables in four groups: condition, safety, functionality and comfort. It covers among others pavement condition, path width, distance from the road, lighting, accident risk, vertical and horizontal geometry, discontinuities, noise and roadside vegetation, weighted by the user survey. Each decision then has its own index:
| Index | Decision |
|---|---|
| Cracks and potholes | Routine maintenance |
| Condition index | Periodic maintenance (resurfacing) |
| Service level index | Improvements such as lowering kerbs, lighting, signage, cleaning |
| Continuity index | New links that join short separate paths into a network |
| Investment index | New construction |
8. Put it in a system
None of this helps if it lives in spreadsheets. The models and rules have to sit in the maintenance information system, update as new condition data arrives, and turn raw data into a draft programme automatically. Then planning gets easier, and anyone can see why each site was chosen.
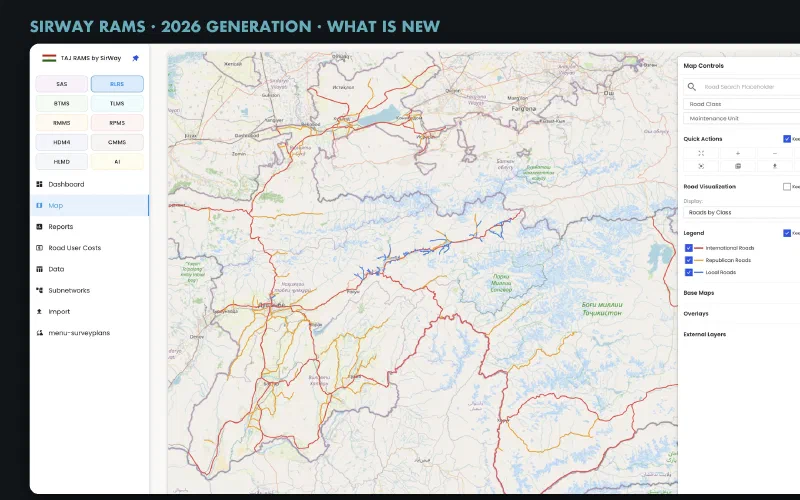
In the project the condition data was loaded into a road asset management system, where the condition index was calculated and the maintenance works planned. SirWay RAMS plans road maintenance the same way, from condition data per segment through weighted indices and maintenance rules to a multi-year programme, and walking and cycling paths can be configured into it as an asset type of their own. Read more about what is new in SirWay RAMS.
Who did the work
The work was commissioned by the Finnish Transport Infrastructure Agency and carried out by AFRY and SirWay, with the Pirkanmaa and North Ostrobothnia ELY Centres. Crowdchupa (now Crowdsorsa) collected the video with its crowd-sourcing game, and Flowity analysed the 2023 video with its computer-vision model. The maintenance planning method was also the subject of a bachelor’s thesis at Häme University of Applied Sciences.
Read more
- T-OMHA / Kävely- ja pyöräilyväylien kunnonhallinnan kehittäminen. Project report 1. Publications of the FTIA 43/2022 (in Finnish).
- T-OMHA / Kävely- ja pyöräilyväylien kunnonhallinta. Project report 2. Publications of the FTIA 40/2023 (in Finnish).
- T-OMHA / Kävely- ja pyöräilyväylien kunnonhallinta. Project report 3. FTIA, 2024 (in Finnish).
- Sirvio, K., Suomela, S., Männistö, V. and Knuuti, M. Towards systematic management of bicycle paths: a case study using gamification and artificial intelligence as constituent of service level index. XXVIIth World Road Congress, Prague, 2023.